
Studies
Electrifying AUto industry
GROWTH IN PAST DECADE IN STATE OF WASHINGTON
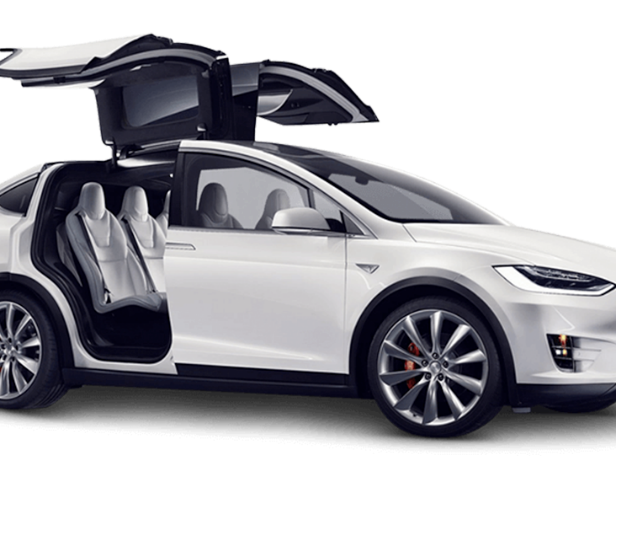
TABLE OF CONTENTS
Introduction………………………………………….1
Historical Context and Growth Trends……………………..1
manufacturing Ramp-up……………………………………..1
General Sales Trend Analysis…………………………….1
Sales by make and model…………………………….2
Tesla Growth Analysis………………………….3
Deep Dive into Leading Models………………………4
Environmental Implications of EV………………………..5
Charging Station Analysis and Its Impact on EV Sales……6
Conclusion………………………………7
Research Citation…………………………………………….7
Introduction

Historical Context and Growth Trends

manufacturing Ramp-up

General Sales Trend Analysis
Sales by make and model
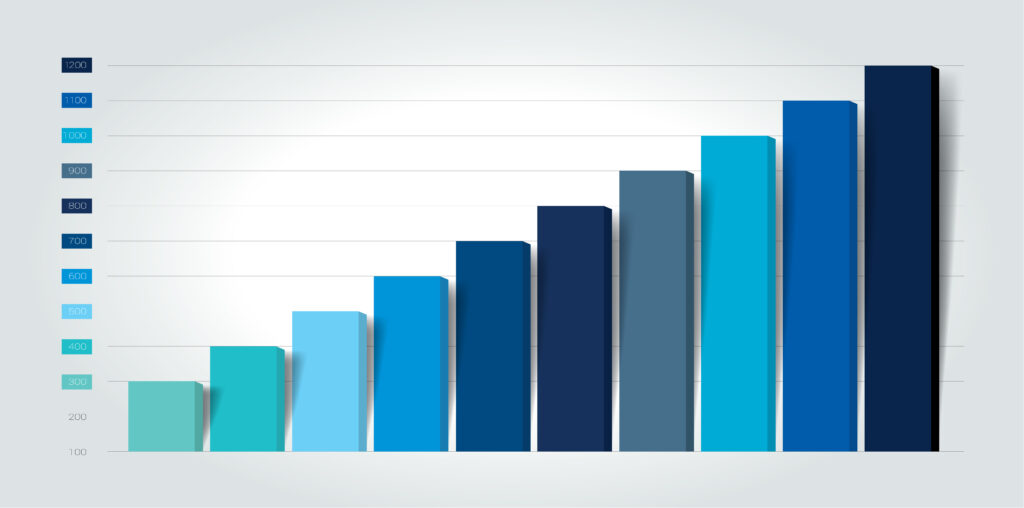
TESLA GROWTH ANALYSIS
Overall Sales:
b. There was a significant jump in sales from 2017 onwards, with sales figures crossing 8,000 in 2018 and consistently staying above this mark till 2023.
c. The grand total sales by the end of 2023 reached 65,533 units, indicating a growing acceptance and demand for Tesla vehicles over the years.
Model-wise Analysis:
b. Model S: Introduced in 2012, the Model S experienced consistent sales from 2012 to 2016. Sales started declining post-2016, with only sporadic sales numbers in the subsequent years.
c. Model X: The Model X began sales in 2015 and saw a relatively steady demand until 2018. After 2018, the sales became more inconsistent but remained in the market till 2023.
d. Model 3: Sales for the Model 3 started in 2017, and it quickly became one of Tesla’s popular models. The sales remained consistently high, with a slight decline in the years following its introduction.
e. Model Y: Introduced in 2020, the Model Y experienced rapid growth and quickly surpassed other models in sales numbers, making it one of the most popular models by 2023.
Peak Years:
b. 2022 and 2023 recorded the highest sales figures, with over 14,000 units sold in each year. This can be attributed to the combined sales of Model 3 and Model Y, which became the dominant models in these years.
DEEP DIVE INTO LEADING MODELS
TABLE OF CONTENTS
TABLE OF CONTENTS
TABLE OF CONTENTS
TABLE OF CONTENTS
ENVIRONMENTAL IMPLICATIONS OF EV
Positive Impacts
Potential Negative Impacts
CHARGING STATION ANALYSIS AND ITS IMPACT ON EV SALES

CONCLUSION

CONCLUSION
RESEARCH CITATION
CONCLUSION
1. Washington enacts clean cars 2030 law (2022) Coltura. Available at:
https://www.coltura.org/washington-clean-cars/
2. Washington Clean Cars (no date) Clean cars – Washington State Department of Ecology. Available at:
https://ecology.wa.gov/Air-Climate/Air-quality/Vehicle-emissions/Clean-cars
3. Electric vehicle charging station locations (no date) Alternative Fuels Data Center: Electric Vehicle
Charging Station Locations. Available at:
https://afdc.energy.gov/fuels/electricity_locations.html#/analyze?fuel=ELEC
4. Electric Vehicle Population Data (2023) Catalog. Available at: https://catalog.data.gov/dataset/electric-
vehicle-population-data